“I gave out 50 cards at that conference – did any lead to business?” With paper cards, you’ll never know. With AAClick Click Card’s analytics, you get answers.
Why analytics matter
Networking costs time and money – event tickets, travel, hours away from work. Without measurement, you can’t calculate return on investment (ROI). AAClick changes that.
What AAClick analytics show
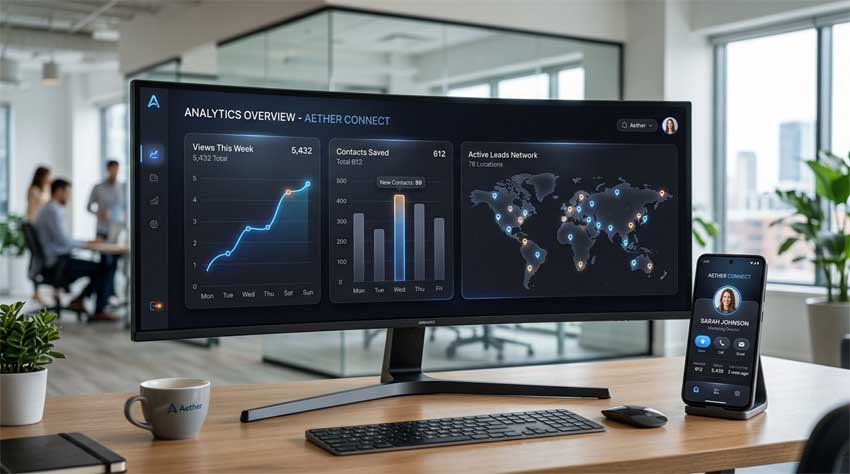
- Total views: How many times your digital card was opened.
- Unique viewers: How many distinct people saw it.
- Contact saves: How many recipients actually saved your VCard to their phone.
- Clicks on links: Which social media or website links got tapped.
- Geographic location: Where viewers are (city/country level).
- Time patterns: When people view your card (helps optimize follow-ups).
How to calculate networking ROI
- Before an event, create a unique Click Card (or use a campaign-specific QR code).
- After the event, check analytics: number of saves = warm leads.
- Track how many of those leads convert to calls, meetings, or sales.
- Divide revenue generated by event cost (including your time).
Example
You attend a 200conference.YourClickCardgets45views,30saves,and5follow−upmeetings.Twomeetingscloseinto200conference.YourClickCardgets45views,30saves,and5follow−upmeetings.Twomeetingscloseinto4,000 in deals. ROI = (4000 – 200)/200 = 1,900%.
Actionable insights
- Low views? Share your link more actively or improve QR placement.
- High views but low saves? Redesign your card – maybe missing a photo or clear CTA.
- Saves from a specific city? Target that region for ads or travel.
Stop guessing. Start measuring. Upgrade to AAClick’s analytics plan today and turn networking into a measurable channel.